
How interest rate differentials affect Forex trading
Reading time: 8 minutes
While most new Forex (FX) traders start by assessing charts, in my experience, understanding risk management, trading psychology, and fundamentals matters far more. My focus here is on one of the most important drivers of FX price action: interest rate differentials. Once you understand them, chart studies (or ‘technical analysis’) become far more useful.
Key Points
- Interest rate differentials measure the gap between two central banks' interest rates and can influence currency valuations and capital flows.
- Short-term interest rate (STIR) futures help traders assess market expectations for future rate hikes, cuts and holds.
- Changes in economic data and central bank expectations can trigger shifts in interest rate pricing and create volatility in Forex markets.
Explaining interest rate differentials
From a trader’s perspective, I think of the Forex market as a ‘relative bet’, because that is what it is at its core. You are not looking at an individual stock, a bond, or an individual currency; you are looking at two currencies that make up a currency pair, such as EUR/USD (the euro versus the US dollar).
That also means you are looking at two different economic landscapes, largely focussing on the differences between inflation (consumer price index), growth (measured by Gross Domestic Product), and jobs. The gap between interest rates is also compared, but ‘expected’ rates are key.
Understanding rate differentials can help provide traders an additional edge. A rate differential is nothing more than the difference between one central bank’s interest rate compared to another. If you are trading the EUR/USD, your attention will be on the European Central Bank (ECB) and the Federal Reserve (Fed). If you are trading the EUR/GBP pair, your focus will naturally be on the ECB and the Bank of England (BoE).
The logic should be intuitive. If the US offers a better return than Europe, capital tends to flow toward higher returns, boosting the USD and weighing on the euro. When yields fall relative to a counterpart, the incentive weakens, and capital can drift elsewhere. And this is the powerhouse behind the classic ‘carry trade strategy’, which at its simplest means that a trader borrows money at a lower interest rate and invests in a higher-yielding one, capturing the difference – or the ‘carry’.
The importance of rate differentials is not the current central bank interest rate; it is what the market expects it to be in the next three months, six months, and a year. Markets are forward-looking. This is why currency values can rise even if a central bank cuts rates: If the market expected several more cuts, but it signals fewer, the currency can rally in relief.
It is vital to recognise that a currency rarely moves not on the decision itself but on the gap between the decision and what was already priced. So the useful question is never simply ‘what is the differential’ but ‘what does the market expect the differential to be, and what could change that expectation?’ Answering that requires a window into market pricing, and that is precisely what interest rate futures provide, which, fortunately, are easily accessible if you have TradingView.
Reading the market’s view with STIR futures
Short-term interest rate futures – or more commonly referred to as ‘STIRs’ – are widely employed for both hedging and speculating purposes. They are not bets on a single central bank decision, nor are they based on government bond yields. Instead, they track short-term market borrowing rates, the rates at which banks lend to one another in the money market. Central banks steer these rates with their policy settings, which is why STIR prices are such a clean read on where the market expects policy to go. Federal funds futures, for example, settle on the average effective Fed funds rate for the month, which is the overnight rate the Fed guides with its target range.
Below is a chart of the 30-day Federal funds futures price. In the upper left corner of the chart, note the symbol ‘ZQZ2026’. ‘ZQ’ refers to the Federal funds futures contract, while ‘Z’ represents the month (December in this case), and 2026 is obviously the year. In order to make these contracts trade like most other instruments – meaning that when you buy (sell), you want prices to rise (fall) – the exchanges use a simple rule:
‘Implied interest rate = 100 minus the futures price’
So, based on the December contract (which aligns with the December Fed meeting), 100 minus 95.930 equals 4.07%. Compare this to the midpoint of the Fed’s current target rate (3.75% and 4.00%): 3.875%, and you will see that 4.07 minus 3.875 gives 19.5 basis points (bps). Since the Fed usually hikes (cuts) in 25 bp increments, this contract implies a 78% chance the Fed hikes rates next month (19.5 / 25.0).
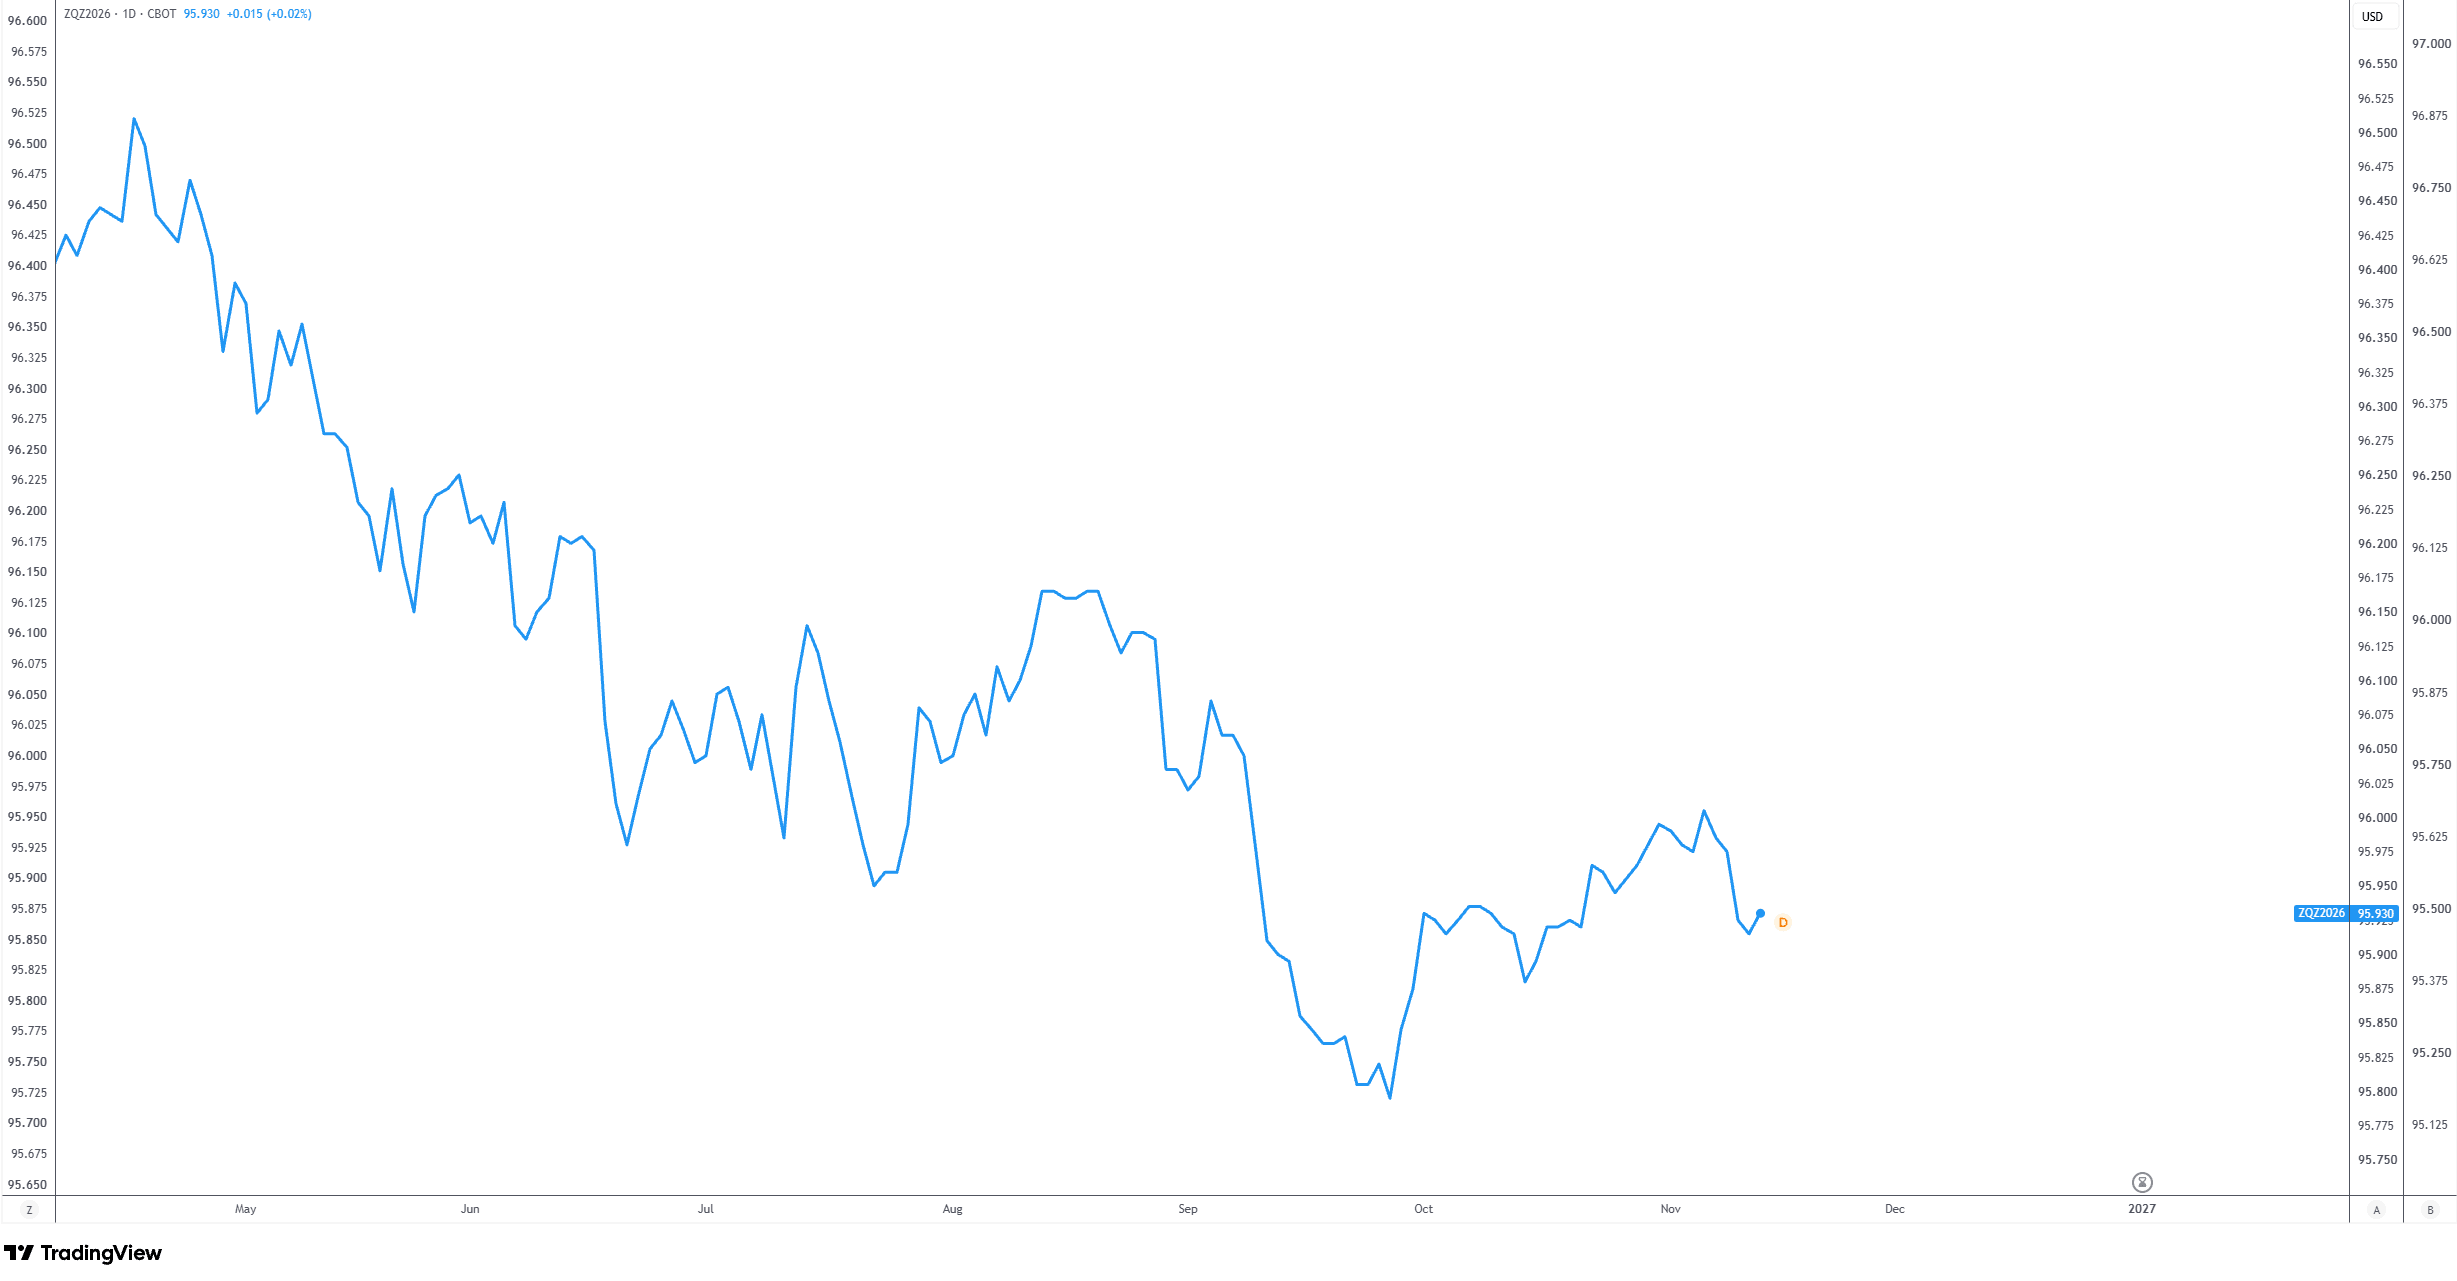
30-day Federal funds futures price TradingView chart
On TradingView, you can add multiple contracts and create an interest rate curve for easier analysis. In the chart below, I kept the December 2026 contract active, added January 2027 (for the January Meeting), and added December 2027 for a year-ahead look.
As you can see, the January contract is trading at 95.835, implying an interest rate of 4.165% and pricing in 29 bps of tightening. This means a rate hike is fully priced in by January, with a 16% chance of two rate hikes occurring over these two meetings. The December 2027 contract is trading at 95.270, implying a 4.73% interest rate and a cumulative 86 bps of tightening. At 25 bp increments, this means the market expects at least three more Fed rate hikes by the end of next year, and just over a 40% chance of another!
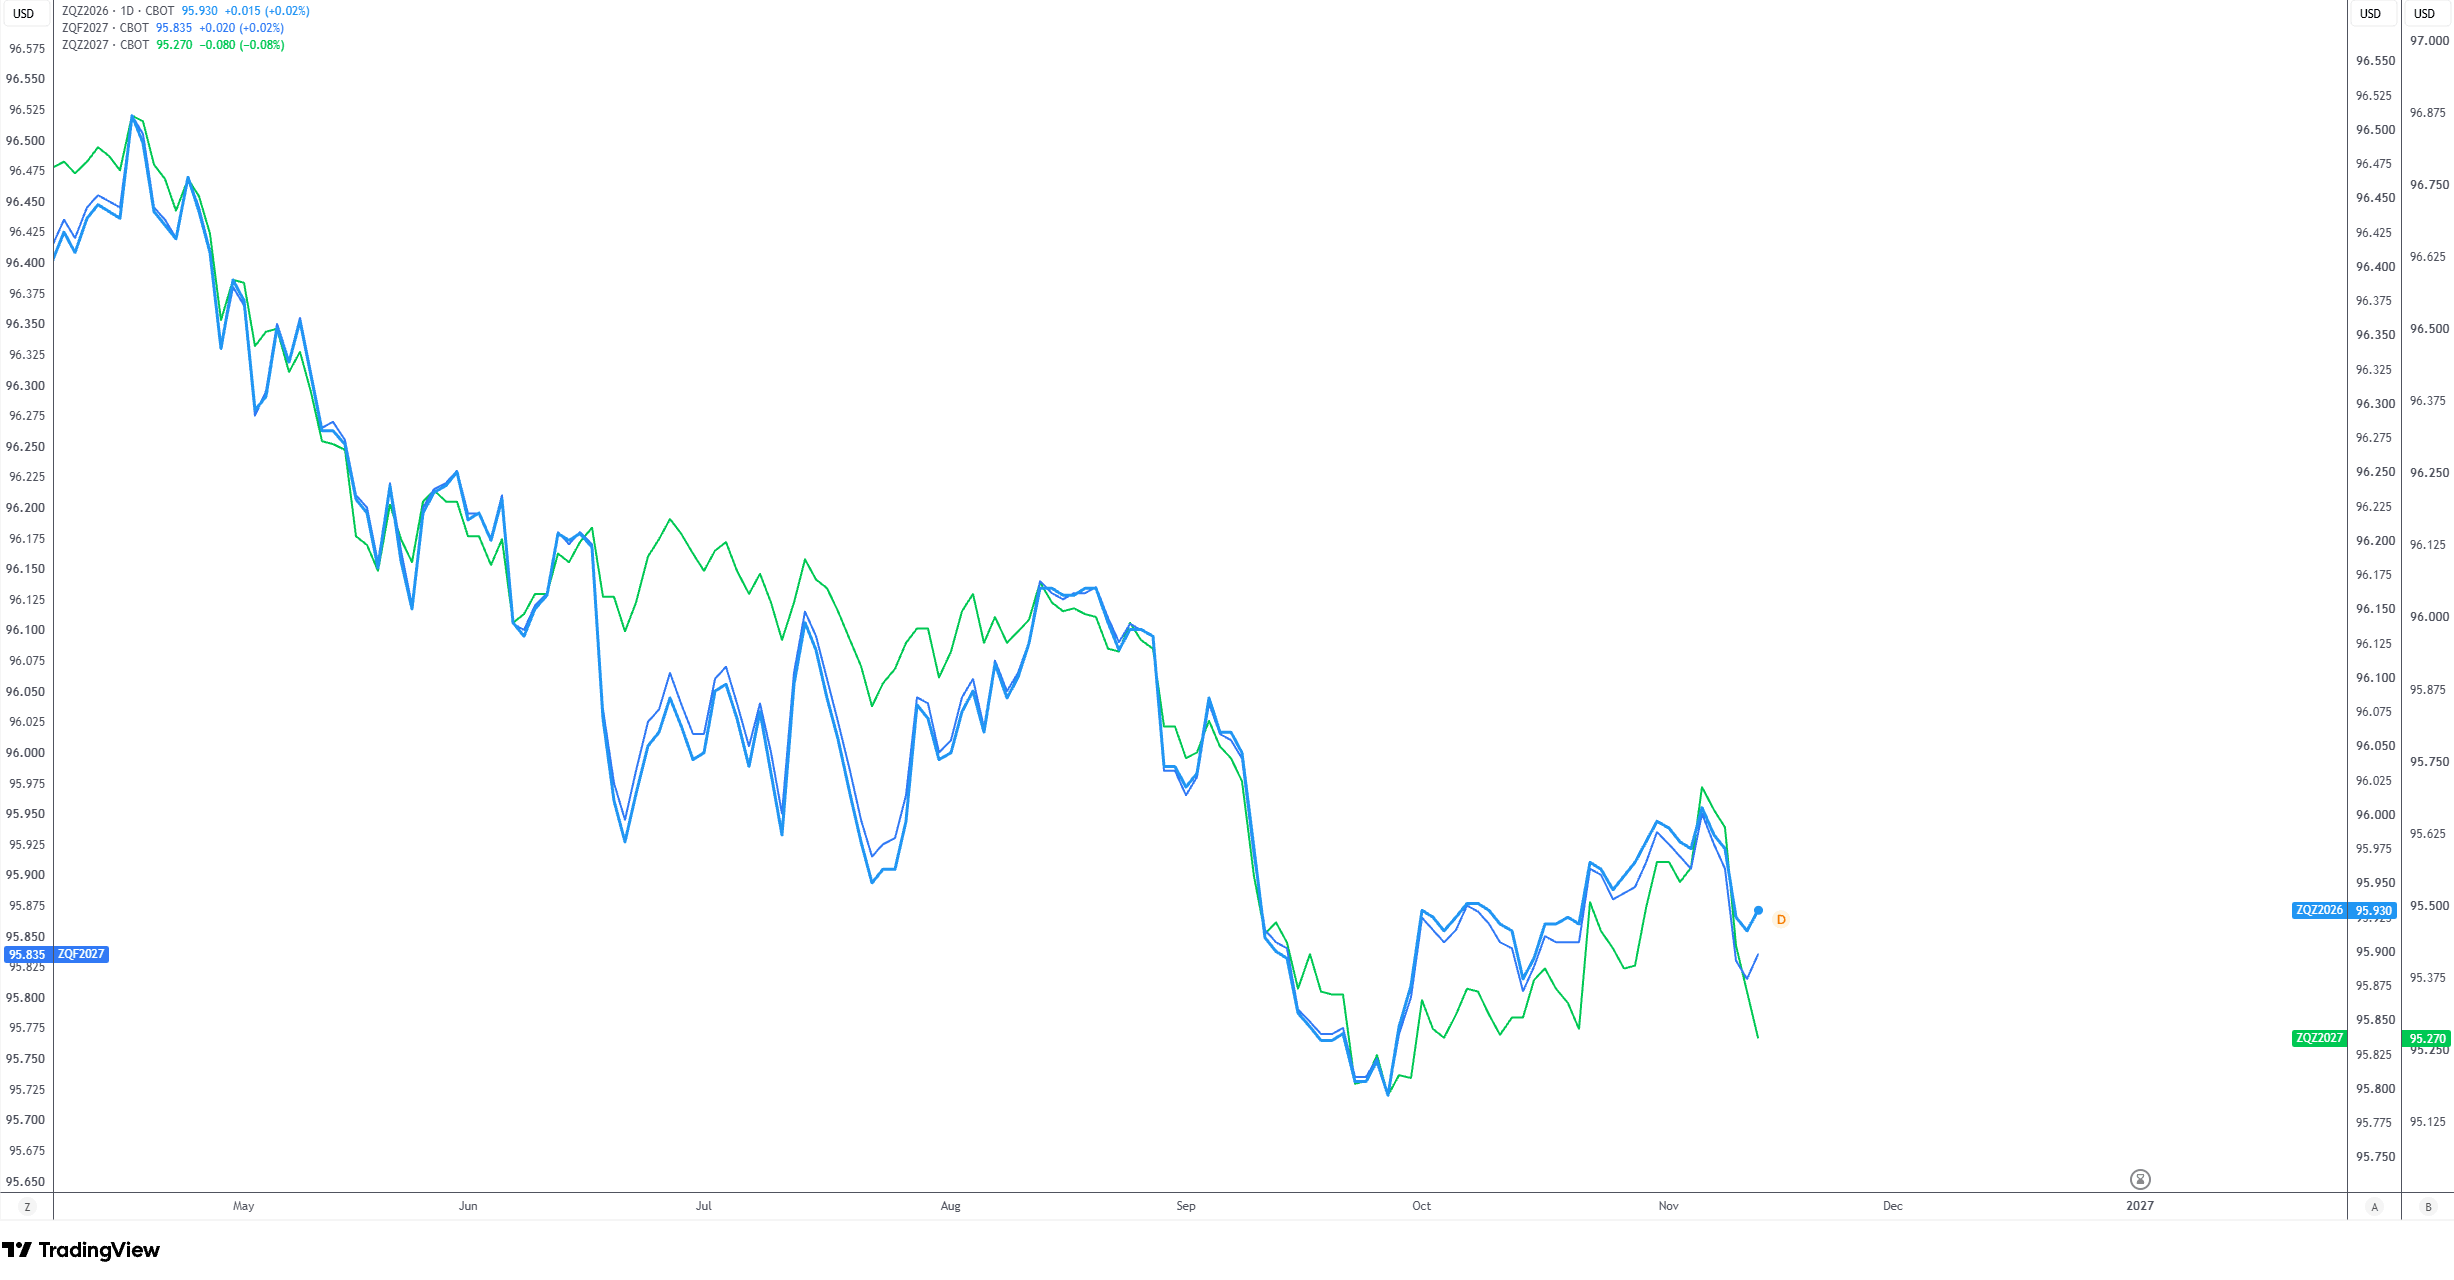
Federal funds futures rate curve TradingView chart
How can I use STIR futures to find an edge?
Tracking the implied rate probability for your traded currencies is vital for Forex traders. In my opinion, it is necessary for all trading styles, from scalpers to position traders. Ideally, you want to track the implied probability of a rate hike, hold, and rate cut. The skill lies in determining what would need to occur in order to shift the implied probability, as that is what moves currency markets. This is key.
Using the federal funds futures example above, the December 2026 contract implies about an 80% chance of a hike. We know this before any key economic data is released.
Suppose that the Fed is hyper-focused on inflation (you must understand what the central banks are focussed on – you can find this in their forward guidance and commentary from the key policymakers who regularly talk to financial news outlets), and the latest inflation report comes in broadly lower than expected. What do you think this will do to the December Fed rate pricing? It will likely trigger a meaningful repricing in Fed fund futures, sending the December contract higher (and potentially even sending the entire curve slightly higher as well).
This is your edge. The market was nearly 100% convinced the Fed will hike rates in December, and when key data pointed to the contrary, it moved both rate pricing and the currency market. The point is, a sizeable downside surprise in the inflation report could cause sharp moves lower in the USD, which tends to bolster currency pairs like the EUR/USD and GBP/USD.
Put your Forex market knowledge into practice
Understanding interest rate differentials and market expectations can help you make more informed assessments of currency movements. With FP Markets, you can explore a wide array of major, minor and exotic currency pairs using advanced trading platforms and analytical tools. Open an FP Markets trading account and put your market knowledge into practice.
Frequently asked questions (FAQs)
Interest rate differentials are the gap between two rates. It is essentially the gap between two different central bank interest rates. For example, the Fed’s target rate at 3.75-4.00% and the ECB’s deposit rate at 2.50% create a gap, or spread, of about 1.4 percentage points (3.875% - 2.50).
Reading STIR futures is surprisingly simple. Using the formula ‘100 - futures price’, this will give you the implied rate for a particular month (best to stick to central bank months). If this implied rate is higher (lower) than the central bank’s current rate, then the market generally expects higher (lower) interest rates in the future.
STIR futures tell you what the market expects (or prices in) for future interest rates. Ultimately, you must check the probabilities of a hike, cut, and hold. Then assess what needs to happen to change those probabilities. You can usually find these catalysts by assessing the central bank’s forward guidance, which tends to focus on inflation and jobs data, or both. If data comes out contrary to what the market is pricing in, you can see meaningful volatility in associated currencies.
Written by FP Markets Chief Market Analyst, Aaron Hill